Contours
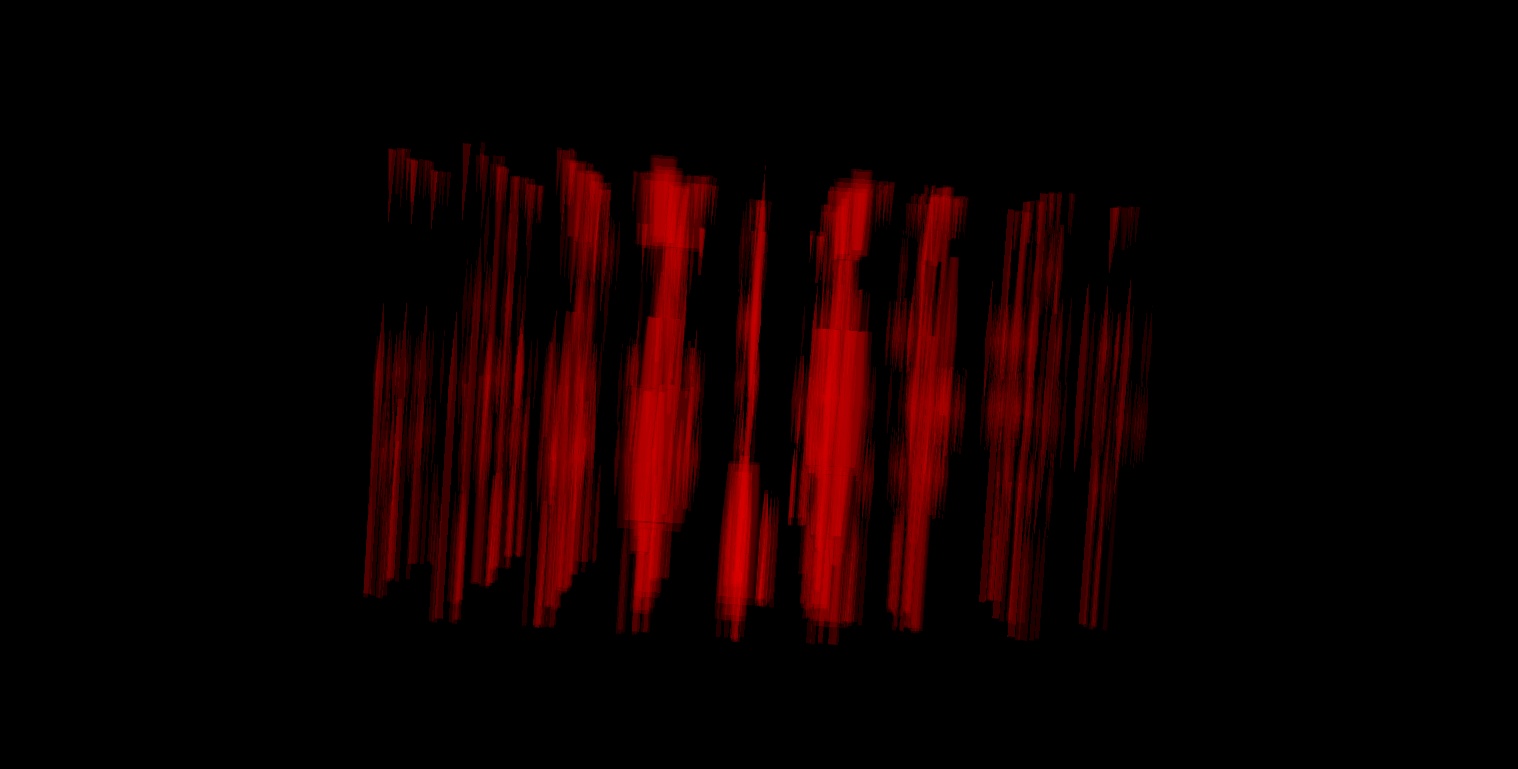
256 K data set, side view of E/M field. Notice the increases at the top.

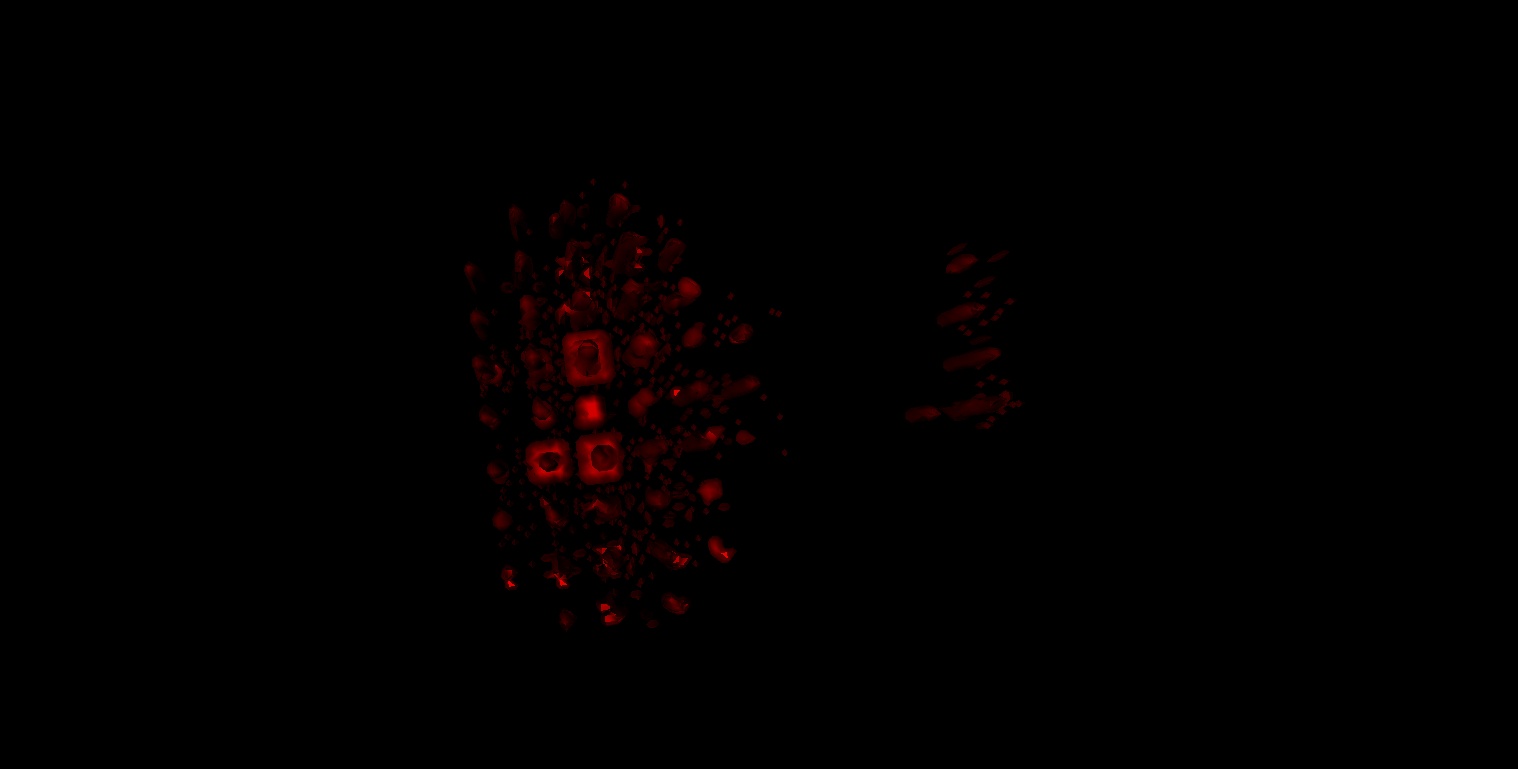
E/M fields, high scale to emphasize the Y data recording levels (see hollow squares in projection)

Emphasis of levels

View of image data set, notice the three dense areas at center (implies shape direction?)

